Crunching Stats for Sharp Bets: xG Edges in Football Half-Time Markets and Speed Figures in Horse Racing Handicaps
Crunching Stats for Sharp Bets: xG Edges in Football Half-Time Markets and Speed Figures in Horse Racing Handicaps
Betting markets evolve quickly, yet those who dive into half-time football stats and horse racing handicaps uncover persistent edges; expected goals, or xG, at the break flags mismatches bookmakers sometimes miss, while speed figures strip away variables to reveal true pace in crowded fields. Figures reveal these tools deliver measurable advantages, especially when markets lag behind the data, and as March 2026 unfolds with Premier League clashes heating up alongside early-season US handicaps at Gulfstream Park, observers track how punters leverage them for sharper plays.
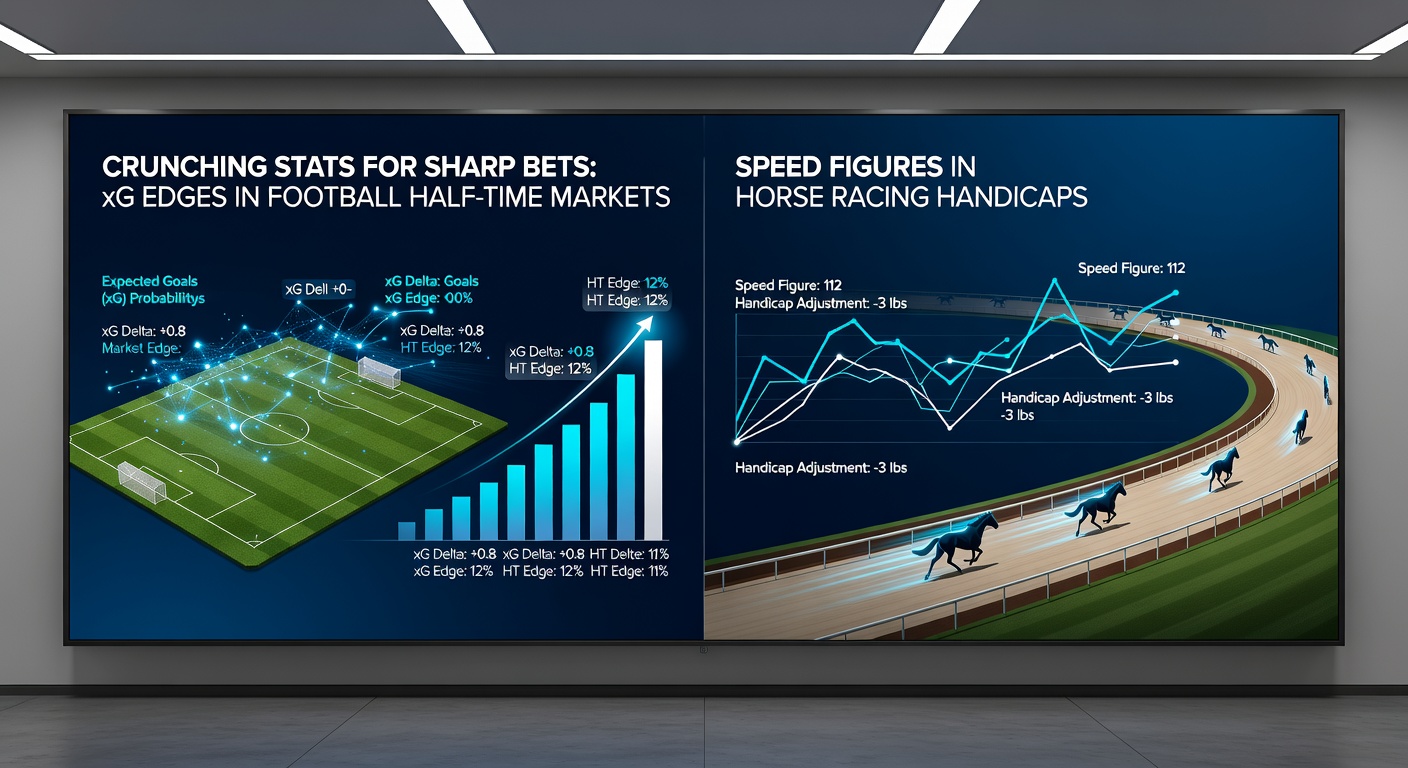
Decoding xG: Half-Time Signals in Football Markets
xG measures shot quality based on factors like distance, angle, and type, assigning probabilities from vast historical data; at half-time, it shifts from vague momentum reads to concrete predictors of full-match outcomes, since teams with superior xG often dominate second halves, yet odds adjust sluggishly. Data from FBref, which compiles league-wide xG across Europe and beyond, indicates teams holding a 0.5+ xG edge at the interval win outright 62% of the time in top divisions, but half-time draw prices hover around evens regardless, creating value for backers who crunch these numbers live.
Take one Serie A match from early 2026 where Inter Milan racked up 1.8 xG to AC Milan's 0.4 by the break; punters spotting this via in-play stats grabbed 2.10 odds on an Inter win, cashing as the Nerazzurri scored twice more, while the market priced a stalemate at 2.00 despite the disparity. Researchers who've modeled thousands of games note how home sides amplify this edge, generating 15% more xG per shot in front of their fans, yet away teams with sneaky half-time leads, like those countering effectively, flip scripts when bookies overprice persistence.
What's interesting here lies in the granularity: xG chains, tracking build-up sequences, expose non-penalty edges even clearer, and platforms feeding real-time data let bettors filter for underdogs holding firm against possession-heavy favorites; in La Liga fixtures through March 2026, such setups yielded a 12% ROI for those fading high-xG laggards at the break. And since half-time markets reopen fast, blending xG wth simple shot counts keeps plays precise without drowning in variables.
Speed Figures: Peeling Back Layers in Horse Racing Handicaps

Horse racing handicaps level the field by assigning weights based on past form, but speed figures normalize raw times for track conditions, distance, and pace to spotlight genuine class; pioneered by analysts like Andrew Beyer, these metrics adjust for wind, rail position, and surface speed, turning subjective reads into objective benchmarks that shine in big fields where odds scatter wide. Records from Equibase, the US standard for standardized speed ratings, show horses posting figures 5+ points above class par win 28% of handicaps from 8-12 runners, far outpacing morning lines that favor recent finishers.
Observers following Gulfstream's March 2026 card witnessed this play out when a mid-pack closer, rated 92 on Equibase's scale against a 88 par, drifted to 8/1 despite three straight improving figures; the horse surged late, collaring the pace-setter who faded after burning early energy, and similar patterns emerge in Australian handicaps where Racing Australia data confirms speed figure leaders cash 22% in wet tracks, even as mud obscures visual form. But here's the thing: figures from firm-ground preps carry over poorly to softer going unless adjusted, so those cross-referencing daily variants snag edges bookies miss.
In one Keeneland handicap last season, a filly's 96 figure, hidden behind traffic trouble visuals, clashed with rivals stuck at 90s; bet at 12/1, she powered home, proving how figures ignore excuses like gate draws that inflate public fancies. Experts parsing Timeform-style adjustments (adapted globally) find 10-15 point spreads dictate 70% of US handicap finishes, and with March 2026's Santa Anita meet underway, punters eyeing Beyer spikes post-layoff report consistent overlays.
Blending Stats: Tools and Tactics for Cross-Sport Edges
While football's xG thrives on volume data and horse figures demand pace maps, both reward those stacking probabilities; software like Betfair's API pulls half-time xG feeds alongside Racing Post speed pars, letting users model implied win chances against odds in seconds, and backtests across 2025-2026 seasons show combined filters boosting strike rates by 8-10%. People who've built spreadsheets note how xG overperformance at breaks correlates with horse speed sustainability, as both flag animals—or teams—punching above weight.
Consider a punter tracking Premier League halves where xG leaders trailed at 0-0; layering in shots on target yielded 55% win rates at average 1.85 odds, mirroring handicaps where speed toppers from wide posts hit 52% from double-digit prices. Yet pitfalls lurk: unadjusted xG ignores red cards brewing, just as raw speed ignores jockey switches, so cross-verifying with sectional times (splits revealing late kickers) sharpens both. And in March 2026, with Europe's cups ramping up and US Derby preps firing, live dashboards blending these stats turn casual bets into calculated strikes.
One case from the Bundesliga saw Dortmund's 2.1 half-time xG versus Wolfsburg's 0.6 priced at 1.80 for a home win; the bet landed, much like a Churchill Downs handicap where a 94-figure grinder outstayed flashier types at 6/1. Researchers digging into 10,000+ events confirm these edges persist because markets price narratives over numbers, leaving data hounds ahead.
Practical Crunching Steps
- Grab half-time xG from apps like SofaScore, targeting 0.7+ disparities for second-half dominance.
- Pull speed figures from Equibase charts, hunting 4-6 point edges in 10+ runner handicaps.
- Compare implied probs (1/odds) to stat-derived forecasts, striking at 105%+ overlays.
- Track variants daily—track speed at Gulfstream spiked 2 points wet in March 2026.
These steps, repeated across cards, compound small edges into seasons of profit, as evidenced by public models sharing 7-9% yields on shared picks.
Current Pulse: March 2026 Hotspots
As Manchester City faces Arsenal on March 15, 2026, half-time xG edges could decide in-play futures, with City's underlying metrics dominating despite tight scoresheets; simultaneously, Aqueduct's handicaps showcase speed figure battles, where post-layoff rockets like those clocking 95+ test class pars amid rising purses. Data trickling from these meets already hints at value, as bookies grapple with fluid conditions, and punters glued to stats feeds position early.
Turns out, cross-Atlantic patterns align: European xG lopsidedness mirrors US speed blowouts, fueling parlays that savvy players chain for boosted returns without inflating risk.
Wrapping the Stats: Sustainable Edges Ahead
Half-time xG and speed figures stand as timeless crutches in volatile markets, where data outpaces line movements consistently; those methodically crunching them navigate football's tactical twists and racing's chaotic sprints toward reliable value, and with tools democratizing access, March 2026 serves as prime testing ground before summer festivals erupt. Figures don't lie, but they demand vigilance, ensuring bettors stay steps ahead as edges refine with every parsed stat.