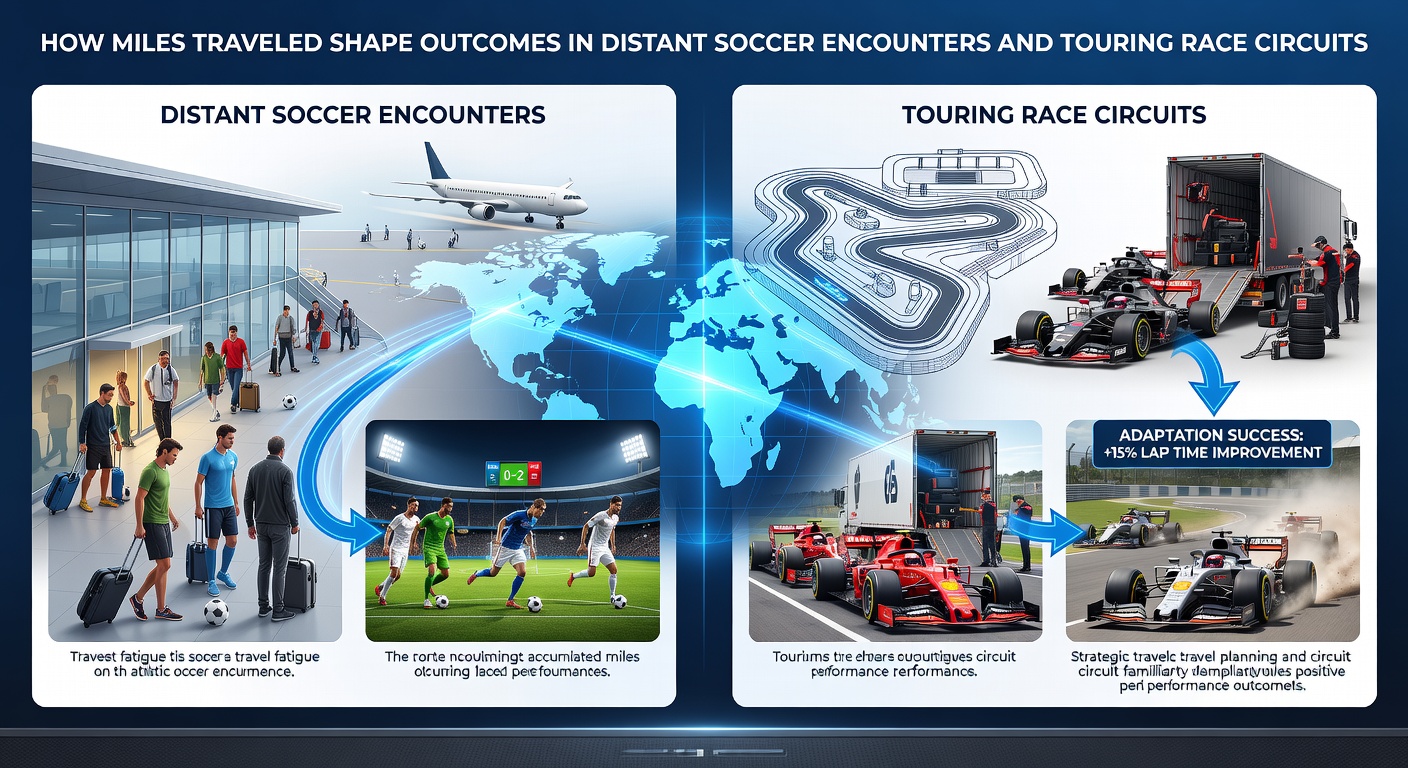
How Miles Traveled Shape Outcomes in Distant Soccer Encounters and Touring Race Circuits
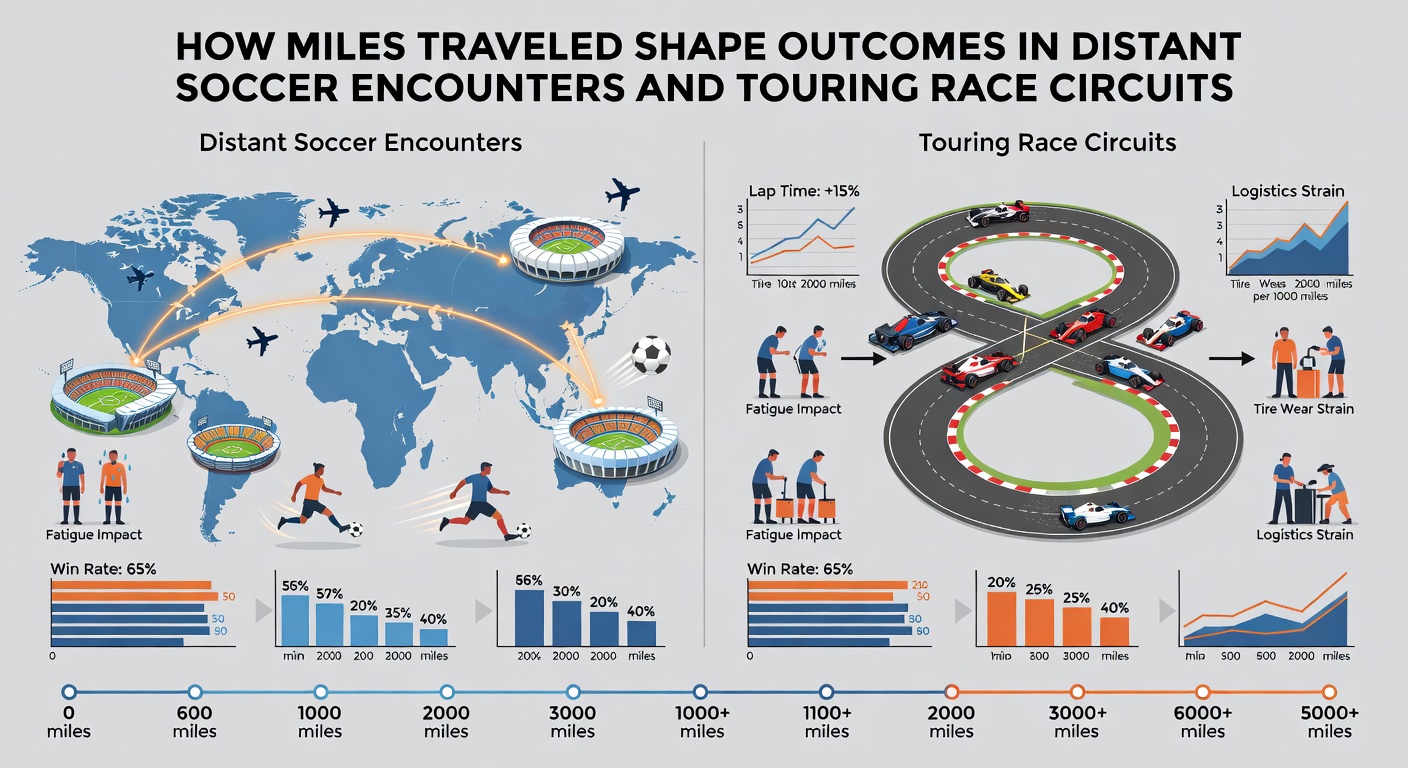
Travel distance exerts measurable influence on performance across soccer fixtures and horse racing circuits, with data from multiple leagues showing consistent patterns in recovery and results. Observers note that teams or runners covering thousands of miles often face elevated fatigue markers, while shorter journeys tend to preserve competitive edges. Research from sports science groups highlights how circadian disruption and physical demands compound during extended trips, shaping win rates and finishing positions in measurable ways.
Travel Demands in International and Domestic Soccer
Soccer schedules in 2026 continue to feature dense calendars that require clubs to cross continents for Champions League ties or intercontinental friendlies, with May marking the tail end of European domestic seasons alongside emerging international windows. Performance analysts track how flights exceeding eight hours correlate with reduced high-intensity running in the first 45 minutes of away matches, according to aggregated match data from major federations. Clubs operating in South American or Asian leagues encounter similar patterns when they traverse domestic expanses that rival transatlantic routes, leading to documented drops in passing accuracy and defensive organization.
Coaches adjust training loads in advance of such journeys, incorporating sleep protocols and hydration strategies that studies link to partial mitigation of jet lag effects. Yet the raw numbers reveal that away sides traveling over 2,000 miles still record lower expected goal tallies compared with those facing regional opponents. European competition records from recent campaigns illustrate this trend across multiple group stages, where distance traveled serves as one variable among several that influence final standings.
Effects on Horse Racing Circuits and Touring Schedules
Horse racing operations similarly expose runners to repeated travel across state or national borders, particularly during spring and autumn festival periods that extend into May 2026 events in Australia and North America. Trainers monitor heart-rate recovery and muscle enzyme levels post-shipment, with figures from industry reports indicating slower times when horses cover distances above 1,000 miles without adequate rest intervals. Australian racing authorities, for instance, publish transport guidelines that correlate longer hauls with reduced strike rates in staying races, prompting many stables to favor local or regional entries when possible.
Those who study equine sports note that ground transport over several hours can produce comparable stress responses to air travel, including elevated cortisol readings that linger into race day. Handicappers therefore examine recent travel history alongside traditional form lines, identifying runners whose prior long-distance moves preceded improved efforts once they acclimatized to new venues. North American circuits provide parallel examples during summer meeting rotations, where horses shipping between tracks separated by hundreds of miles show variable success rates depending on layoff duration and journey conditions.
Comparative Factors Across Both Sports
Common variables emerge when analysts compare soccer and racing datasets. Recovery windows, acclimatization periods, and environmental shifts all interact with mileage totals, producing outcomes that betting markets and performance models attempt to quantify. Data from academic institutions such as those affiliated with the International Society of Sports Nutrition demonstrate that nutritional timing and sleep hygiene protocols yield measurable benefits for both athletes and equine athletes following extended travel.
Time-zone changes add another layer in soccer contexts, while temperature and humidity swings affect racing participants more directly during cross-country moves. Observers tracking multi-leg tours find that cumulative fatigue builds across successive fixtures or races, with performance decrements becoming statistically significant after the second or third long journey within a short span. Regulatory bodies in different regions, including Transport Canada guidelines on animal welfare during shipment, emphasize rest requirements that mirror human athlete recovery recommendations issued by similar oversight groups elsewhere.
Case Examples from Recent Seasons
One documented instance involved a European club that traveled more than 6,000 miles across two weeks in the spring of 2025, resulting in lower possession metrics and fewer shots on target during subsequent domestic fixtures. Racing parallels appear in Australian staying events where horses arriving from interstate stables posted lower win percentages unless granted extra days between arrival and competition. Such patterns recur across datasets, prompting scouts and form students to incorporate travel metrics into broader evaluation frameworks.
Technology now assists these assessments through wearable devices that log movement and recovery data for soccer players, alongside GPS trackers used in equine transport vehicles. These tools supply granular information that researchers aggregate to refine predictive models, revealing how even modest increases in distance can shift probabilities when other variables remain constant.
Conclusion
Distance traveled functions as a persistent variable that shapes results in both distant soccer encounters and touring race circuits, supported by performance records and physiological measurements compiled over multiple seasons. Those examining upcoming schedules in May 2026 and beyond continue to integrate travel data with traditional indicators to better understand competitive dynamics. The patterns remain consistent across regions and disciplines, underscoring the practical value of accounting for mileage when assessing likely outcomes.